

Observe where it matters
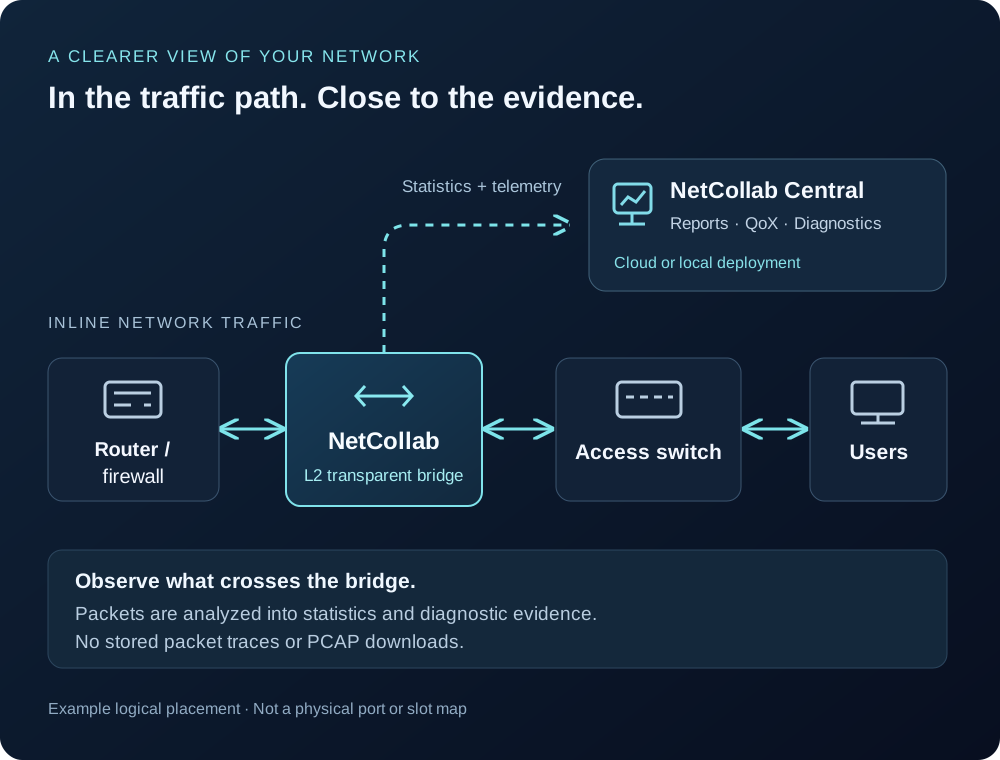
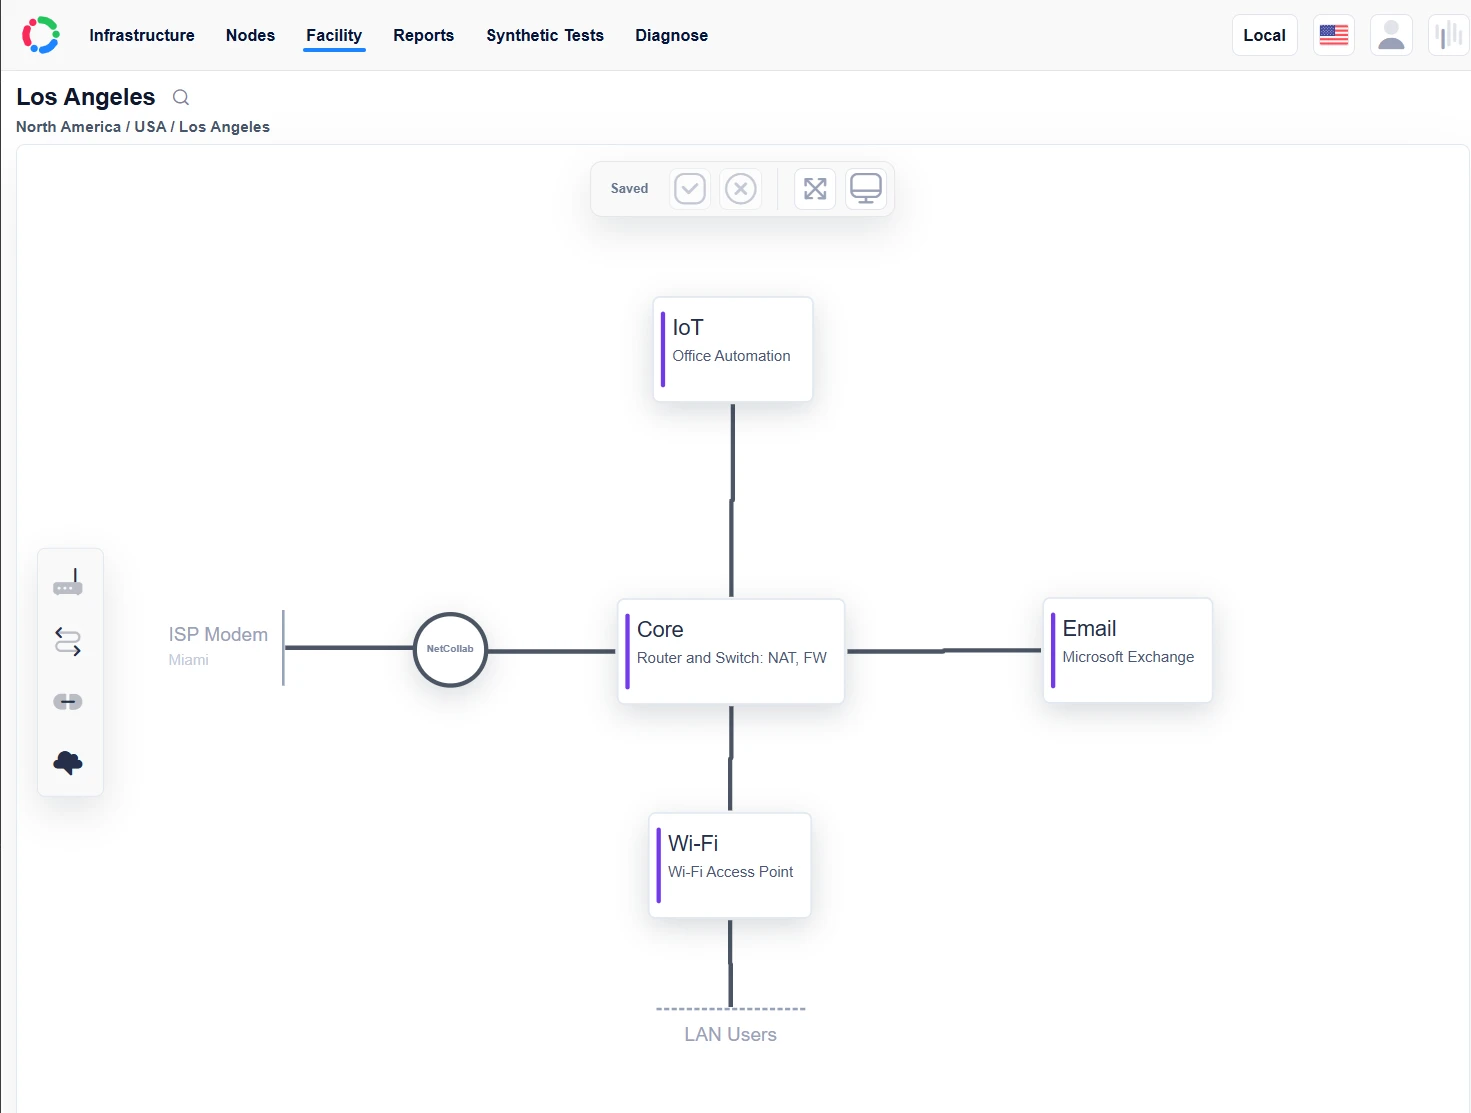
Place a bridge between network components to see the traffic crossing that point. Choose the observation point around the problem you need to investigate.
For SMB IT teams
Network Monitoring & QoX
Put a monitoring node in the traffic path. Turn packet analysis into performance statistics and diagnostic evidence, then investigate what users experience through reports in NetCollab Central.
Monitoring node · Layer 2 transparent bridge · Included with NetCollab hardware
 Explore the diagram ↗
Place a bridge between network components to see the traffic crossing that point. Choose the observation point around the problem you need to investigate.
Use synthetic tests between nodes or toward the cloud to add active measurements alongside observed network traffic.
Use analyzed traffic statistics, reports and diagnostics to give your team and service providers something concrete to investigate.
Understand the observation point
A monitoring node operates as a Layer 2 transparent bridge in the traffic path. It observes traffic traversing that bridge and generates statistics for analysis. It is an observation point, not a claim of visibility into every part of the network.
 View full screenshot
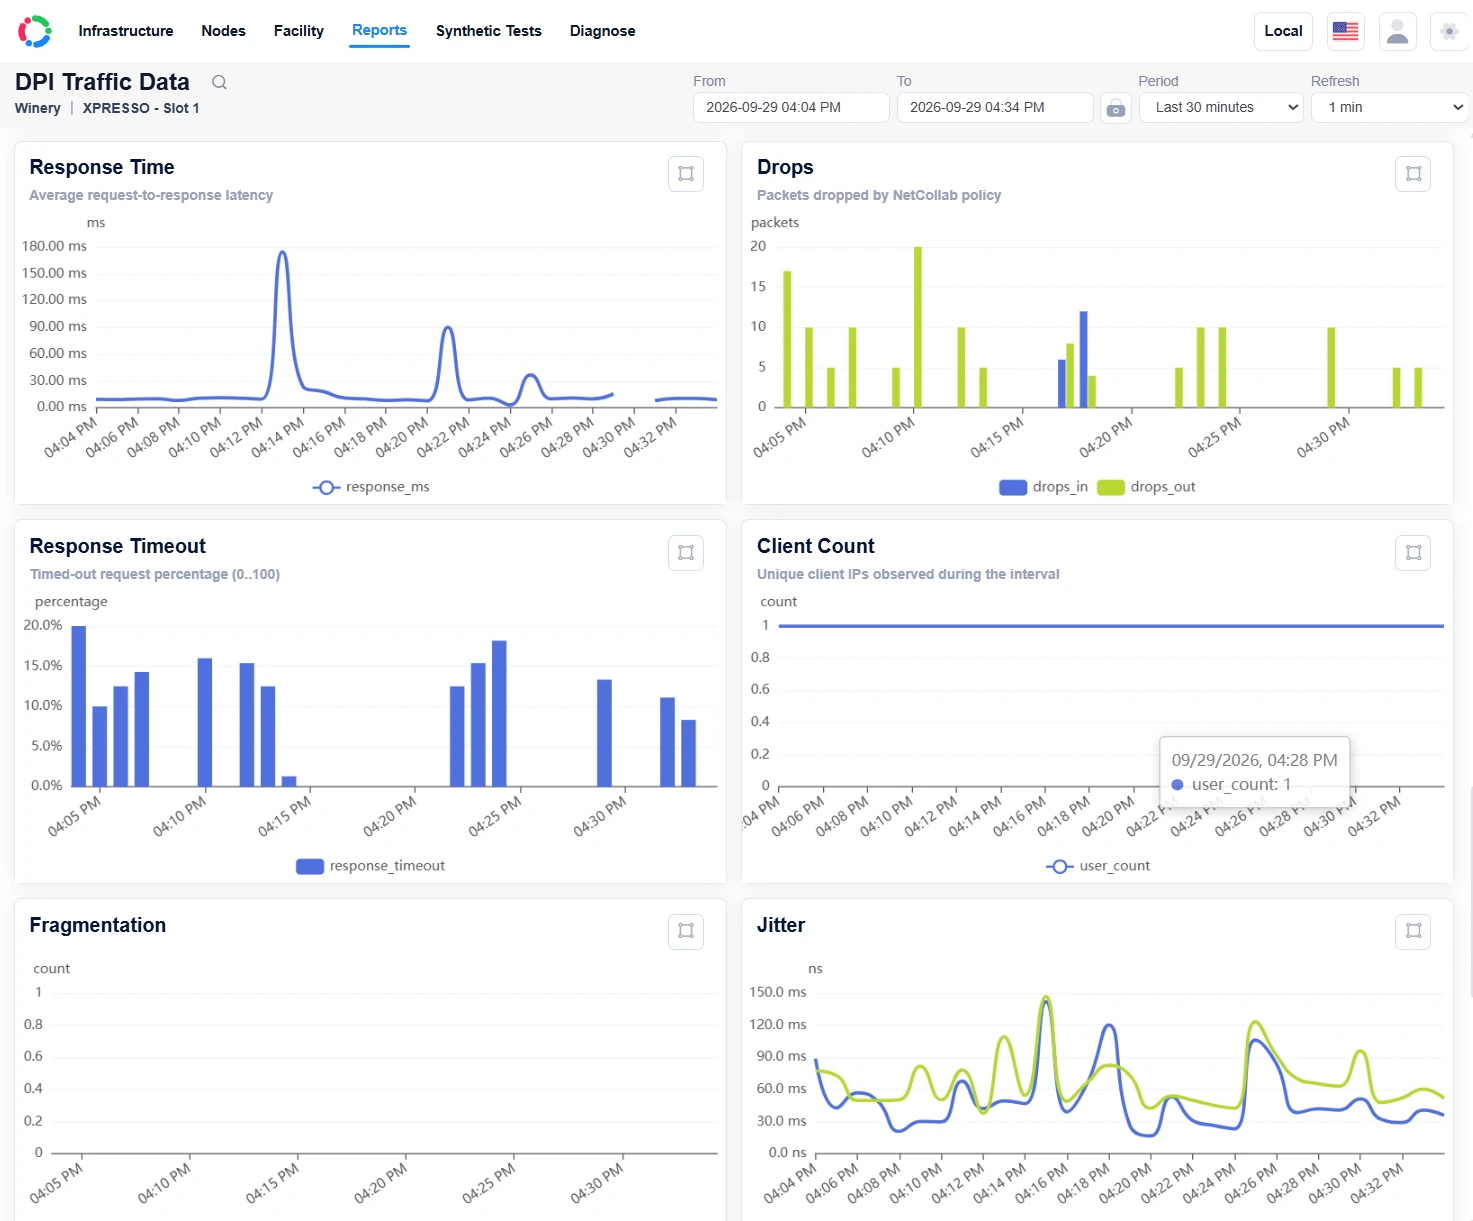
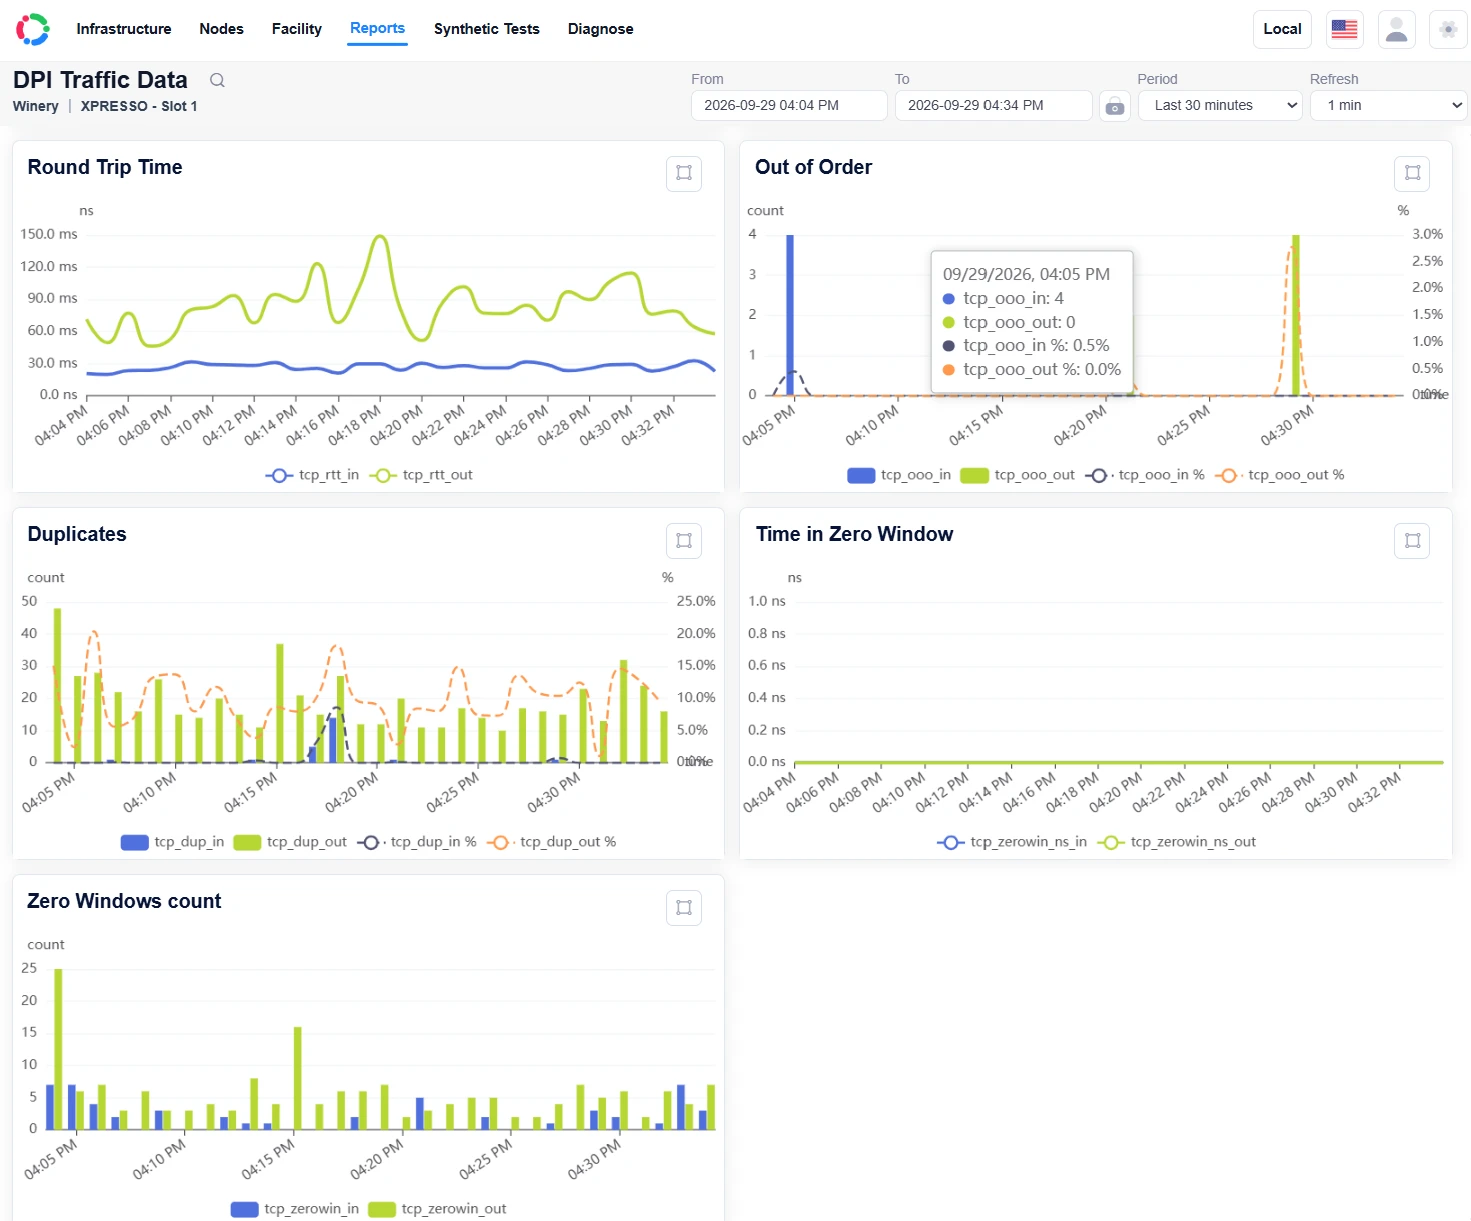
 From packets to answers
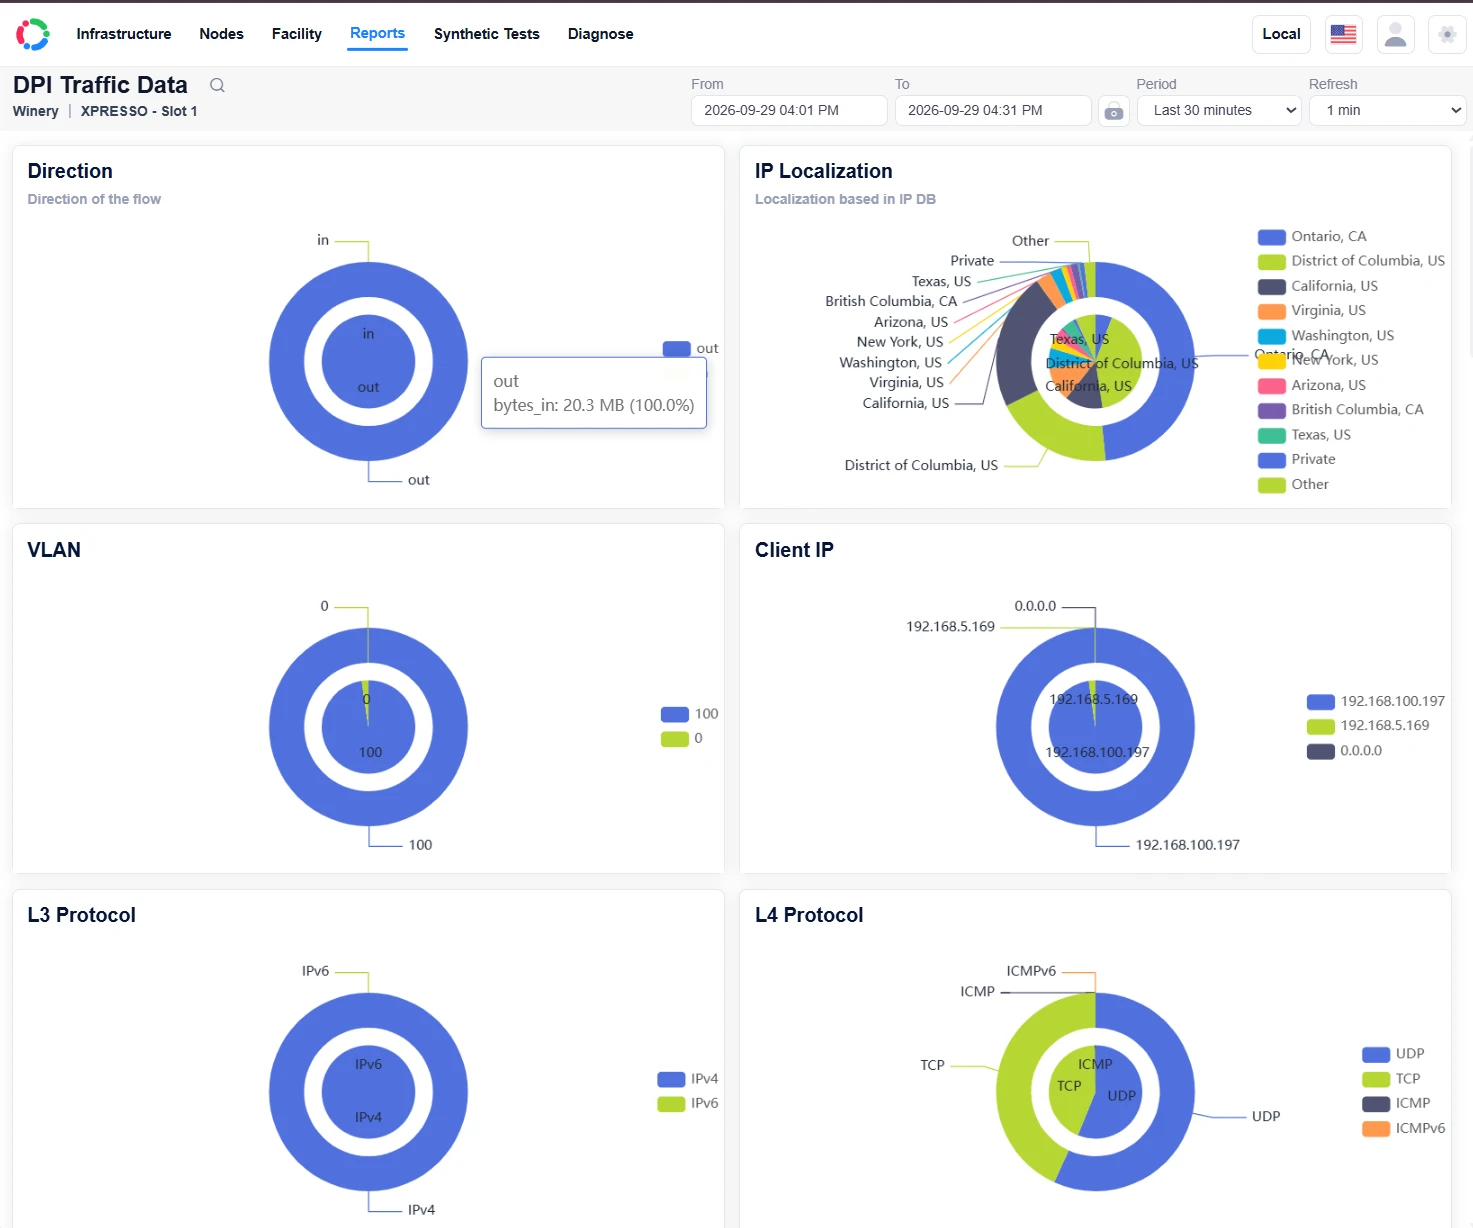
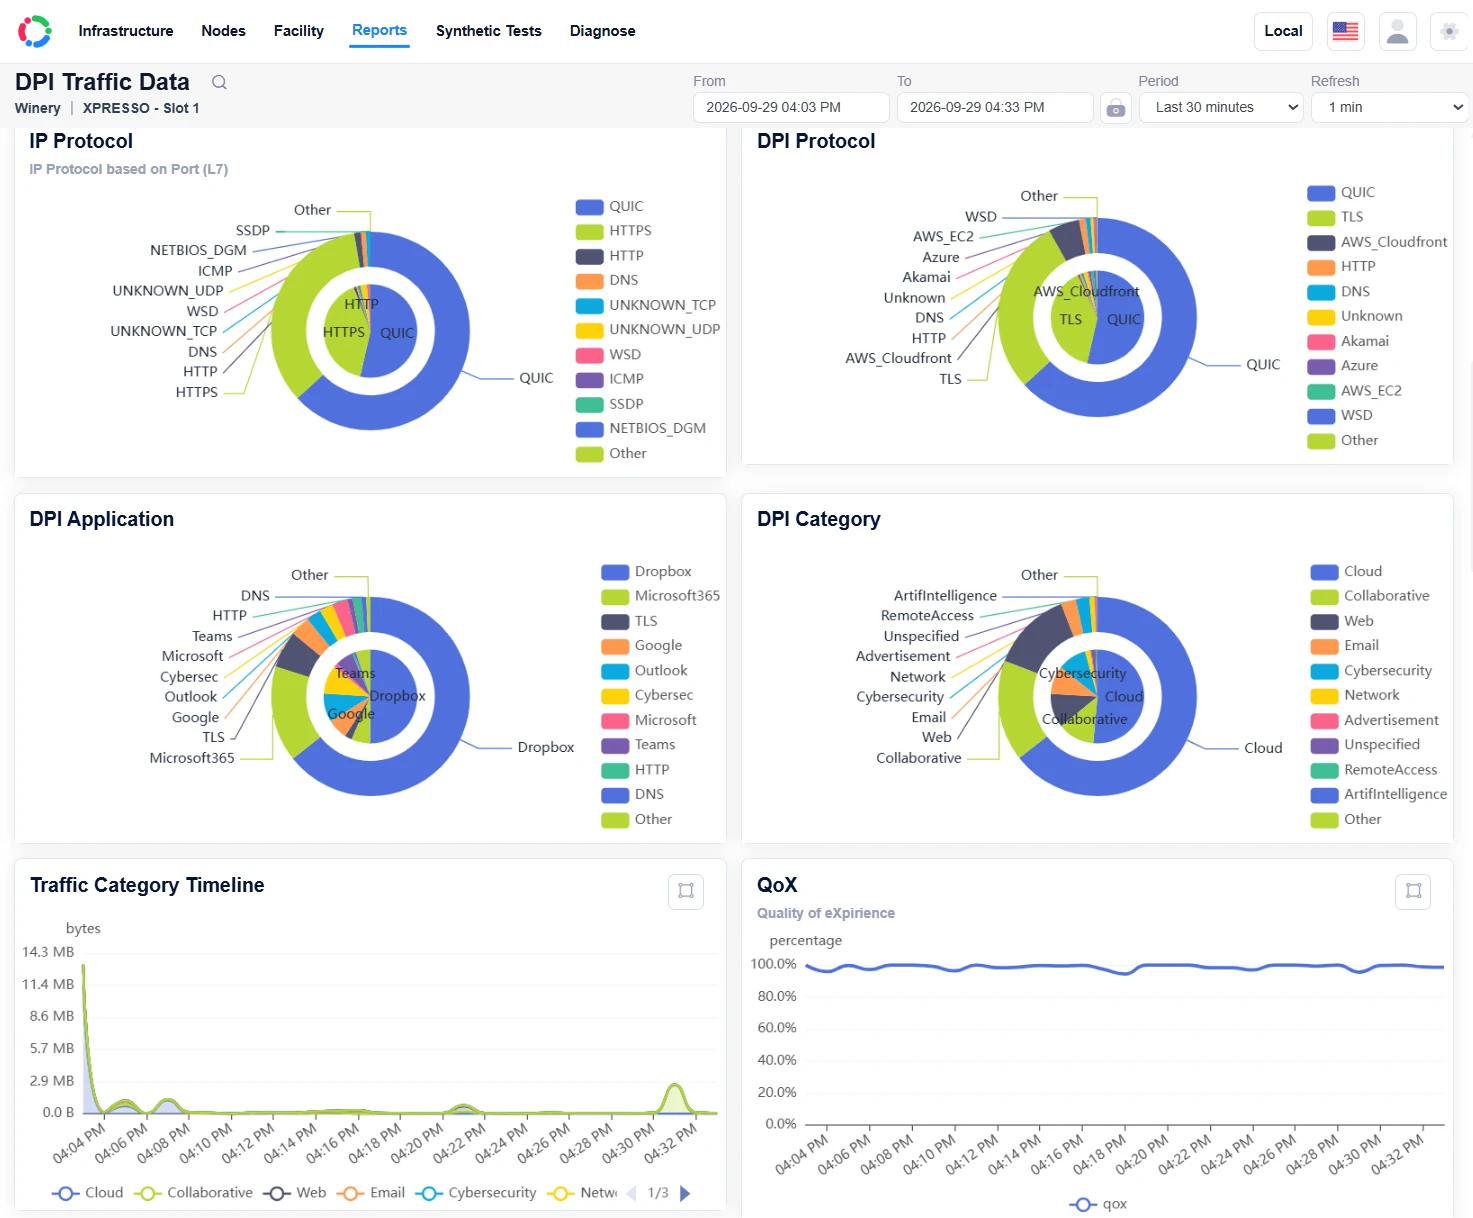
NetCollab analyzes packets passing through the bridge to generate performance statistics, loss measurements and diagnostic information. Get the packet-level perspective behind an investigation without having to work through a packet trace yourself.
 View full screenshot
  View full screenshot
  View full screenshot
  View full screenshot
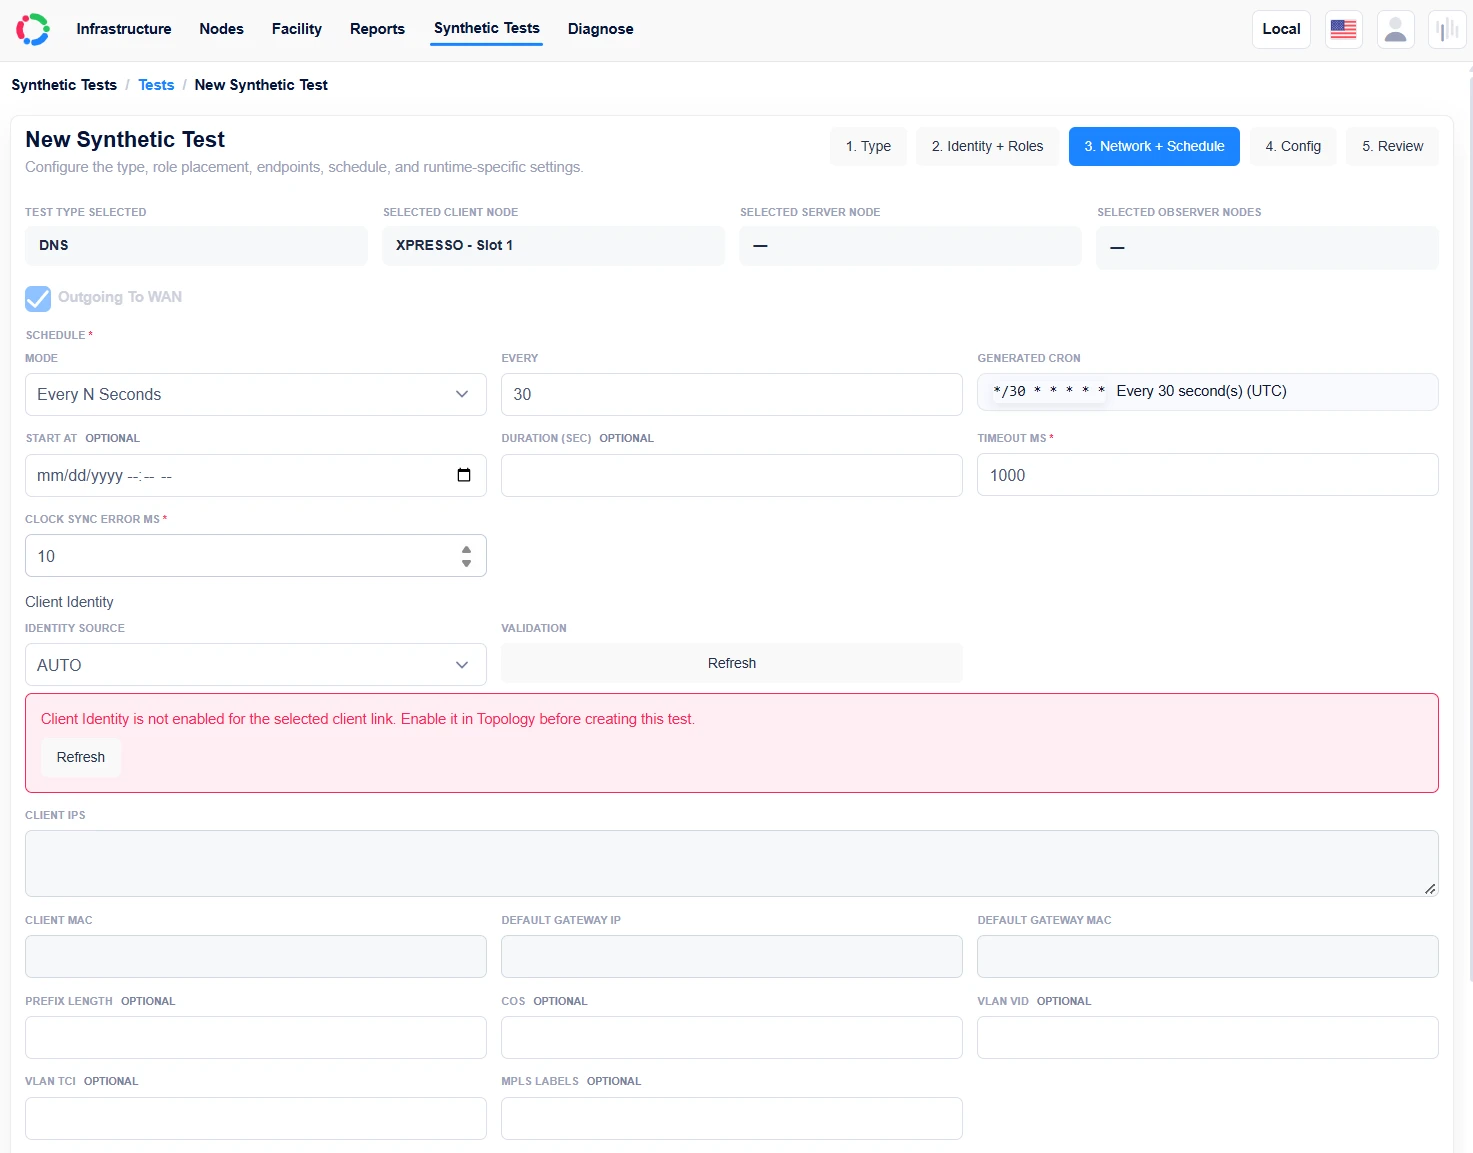
 Observe traffic. Actively test paths.
Run scheduled ICMP, DNS and UDP tests between participating nodes or toward suitable cloud endpoints. Choose the path, start time and run window to add active measurements alongside observed traffic.
 View full screenshot
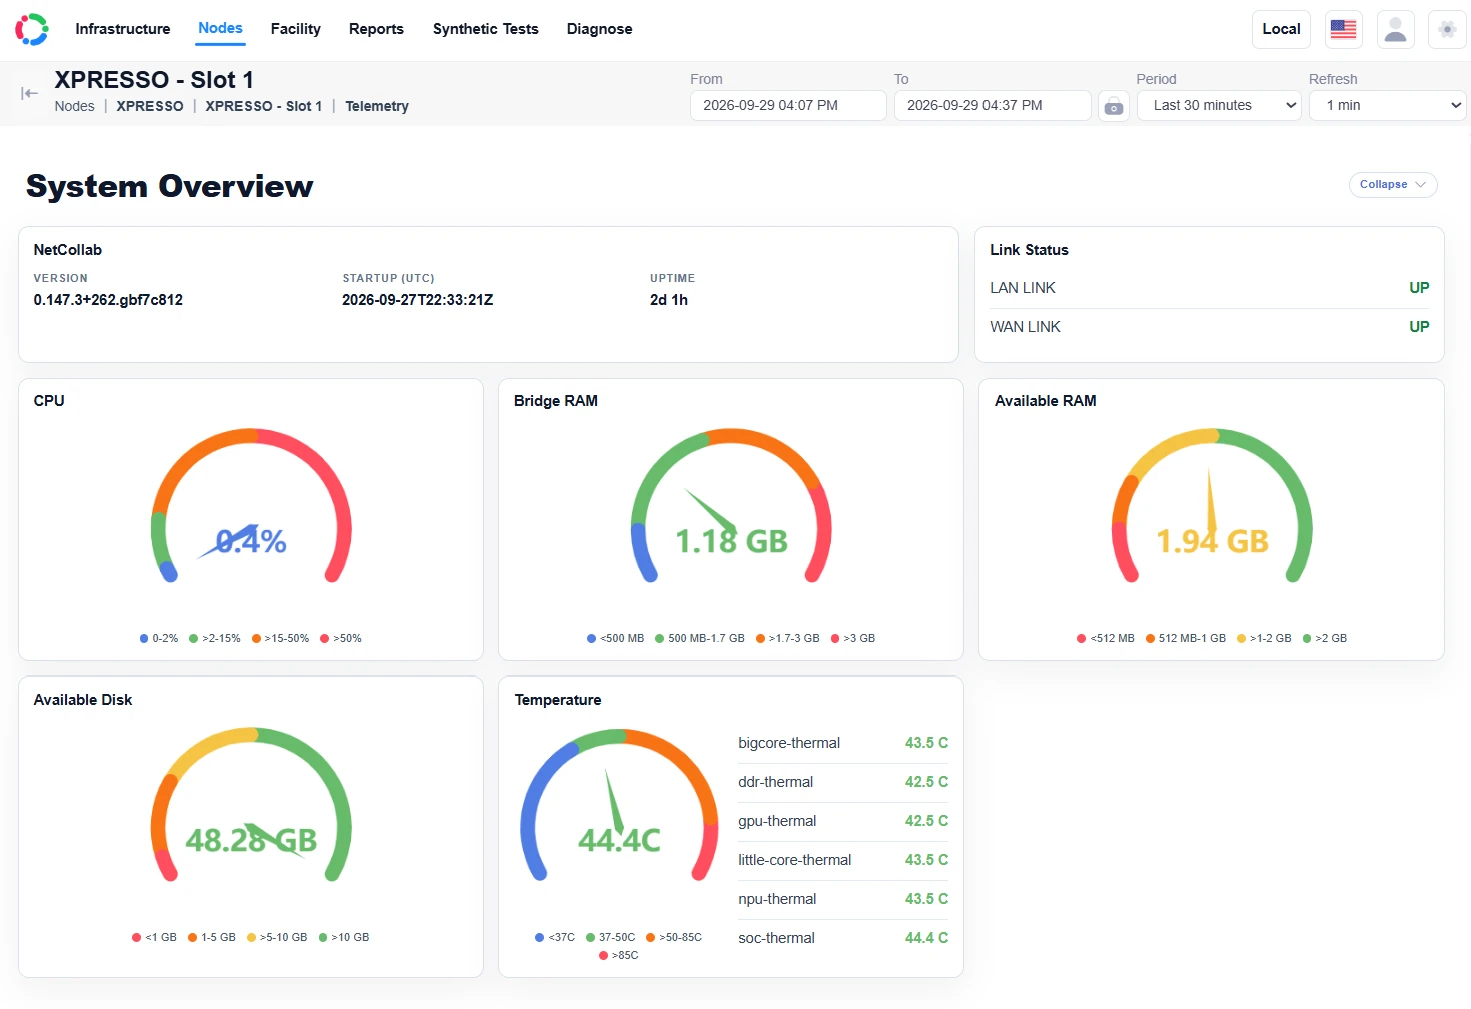
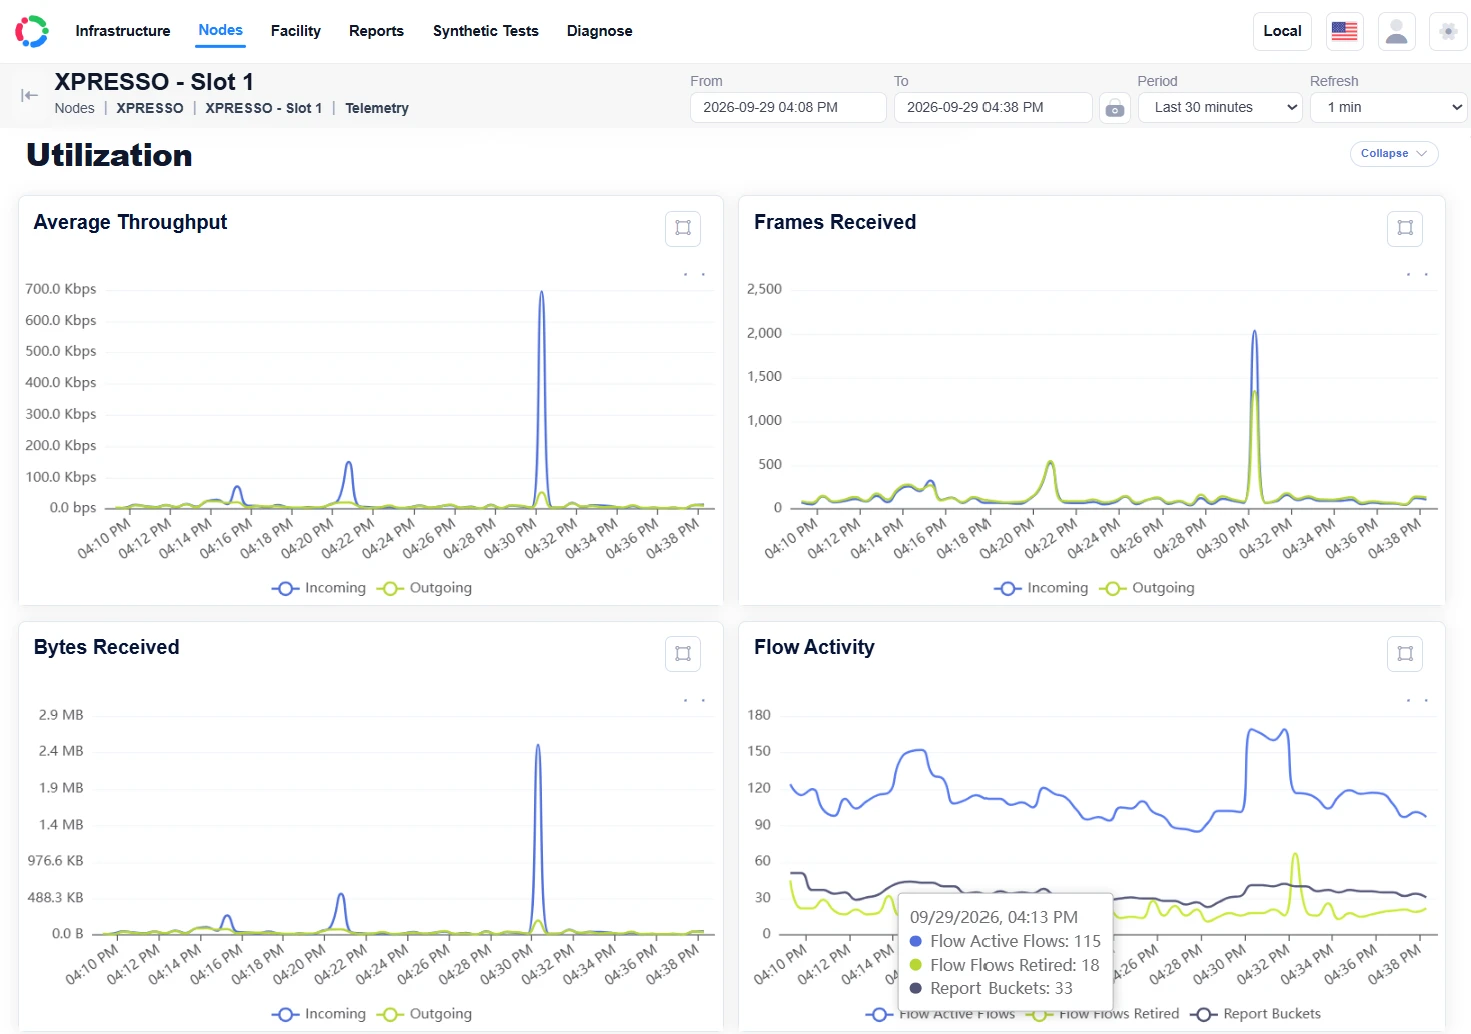
 Know the health behind the measurements
Node telemetry helps you assess whether the bridge itself is under pressure while you investigate the network. Read resource usage and processing health alongside traffic reports.
 View full screenshot
  View full screenshot
 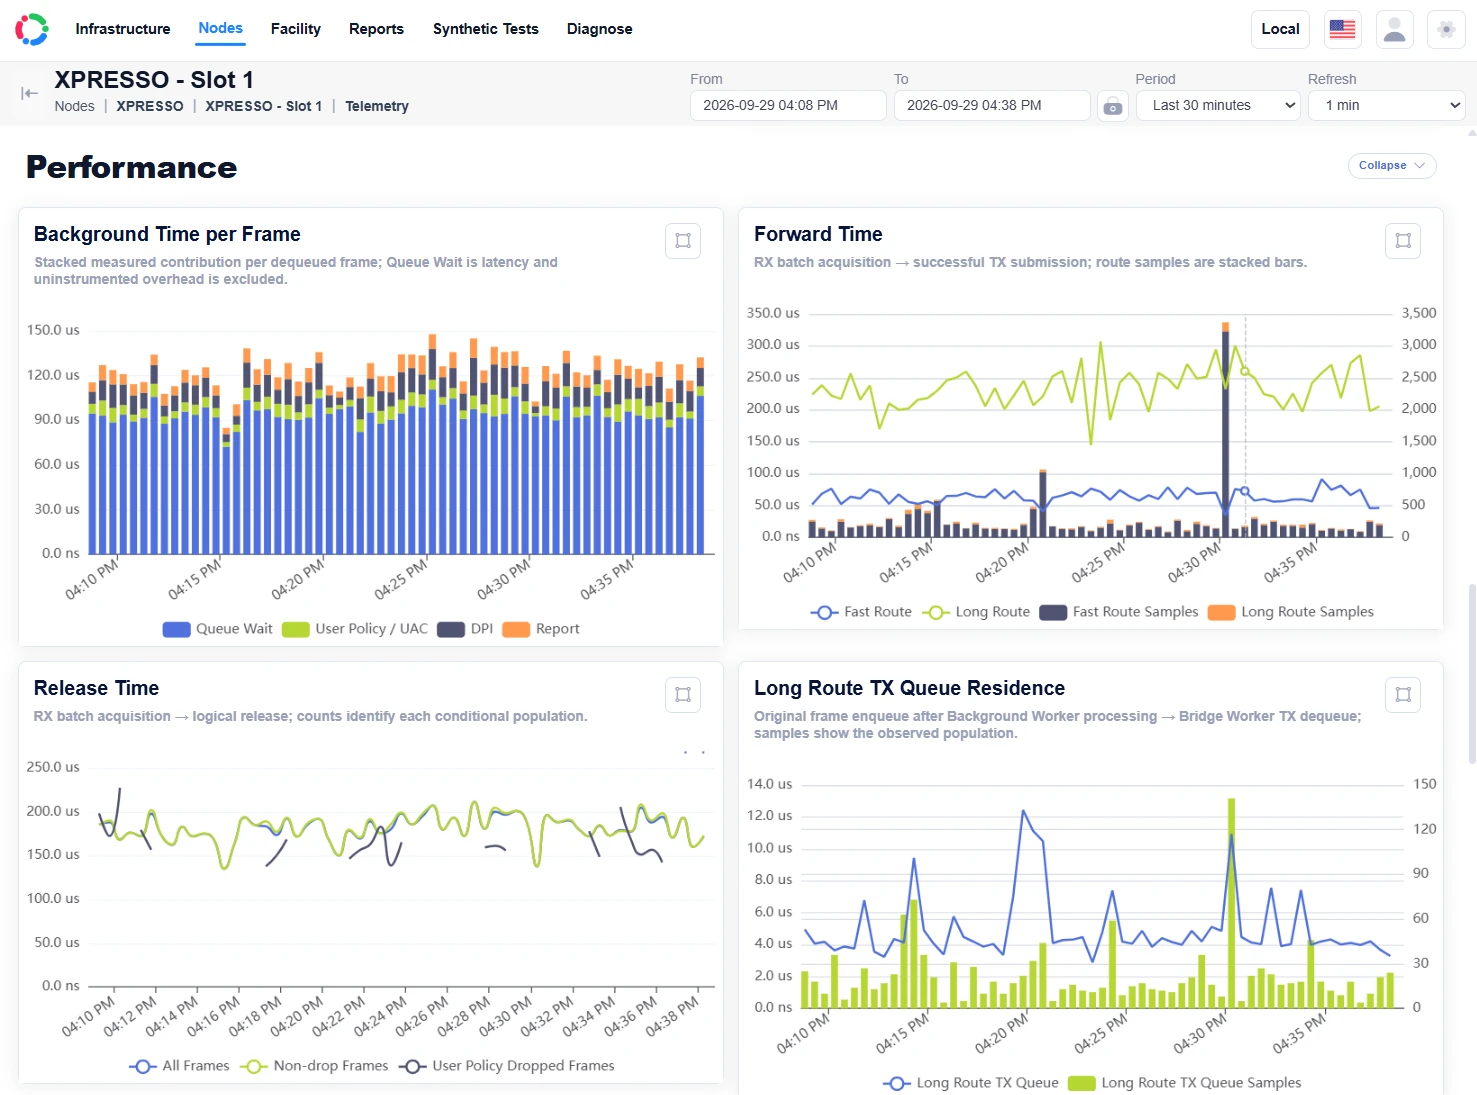 View full screenshot
 The bridge collects. Central explains.
Enable a specific node to gather the data your investigation needs. Choose reporting granularity, schedule a start time and duration, and filter by protocol, category, IP address or MAC address to keep detailed reports manageable.
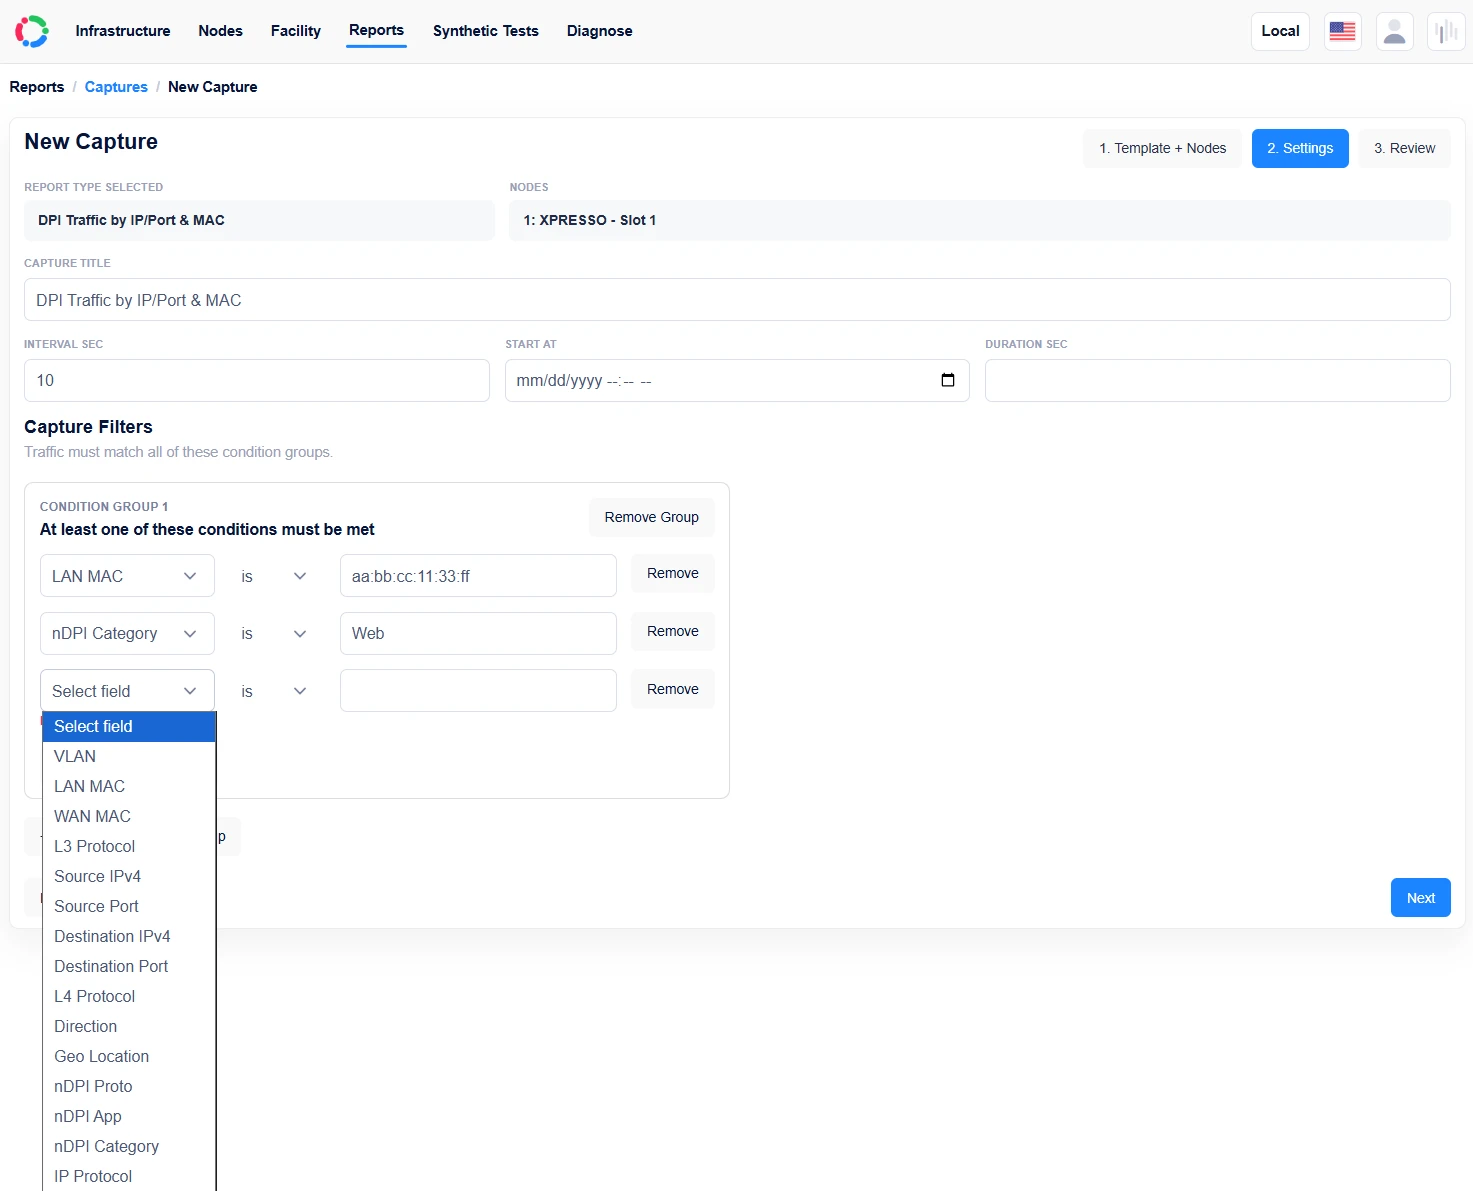 View full screenshot
 Choose the detail you need, then use filters and a collection window to control the scope.
Gather source IP, IP geolocation, protocol and destination IP. Filter to an IP address or protocol of interest. Geography provides context, not proof that traffic is malicious.
Collect DPI categories, applications and protocols across users. Filter to a category when you want to understand one type of activity more closely.
Use the five-tuple—source and destination IPs, source and destination ports, and protocol—with selected metrics, QoX and DPI. Filter by protocol, category, IP or MAC address and schedule a limited collection window to make a detailed per-connection report manageable.
Two roles included. Room to grow.
NetCollab hardware includes both Guest Wi-Fi & Captive Portal and Network Monitoring & QoX. A slot runs one configured node role; the number of slots determines what you can run at the same time.
Choose one role at a time. Both role options are included with the device.
One UAC + three monitoring roles, or four monitoring roles. These are confirmed configuration examples.
Meet NetCollab Central
Explore facility maps, network diagrams, reports and diagnostics in Central—a separate management and reporting product available in the cloud or on your own network.
Explore NetCollab CentralBuild around your network
Choose your hardware, explore pricing, and discuss your use case with us.