

Start with the organization
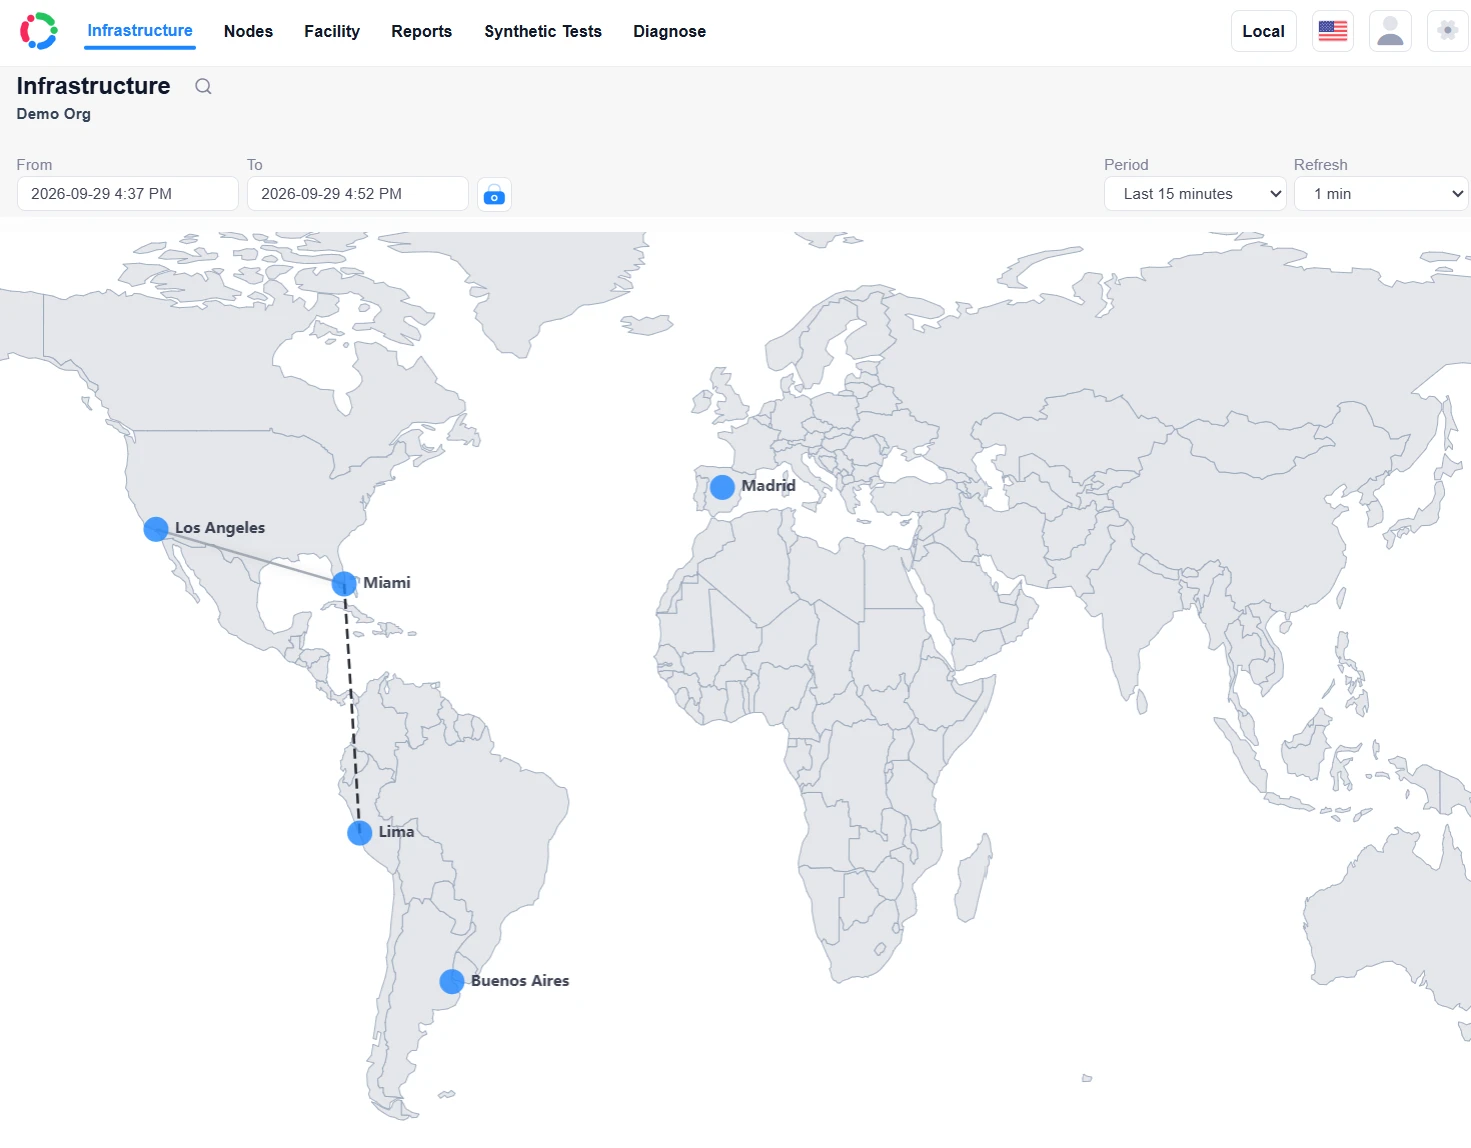
Use facility maps and network diagrams to understand the deployment before opening the details of an investigation.
For IT teams & organizations managing NetCollab
NetCollab Central
Bring your facilities, network reports and diagnostics into one management platform. NetCollab Central combines the frontend, APIs and reporting database—with cloud and local deployment options.
A separate product · Management frontend + APIs + reporting database
 View full screenshot
 Use facility maps and network diagrams to understand the deployment before opening the details of an investigation.
Explore traffic reports, QoX, alarms and synthetic results produced from your NetCollab deployment.
Use Central Cloud or discuss a local hardware deployment for managing the platform and reporting data on your own network.
From place to network
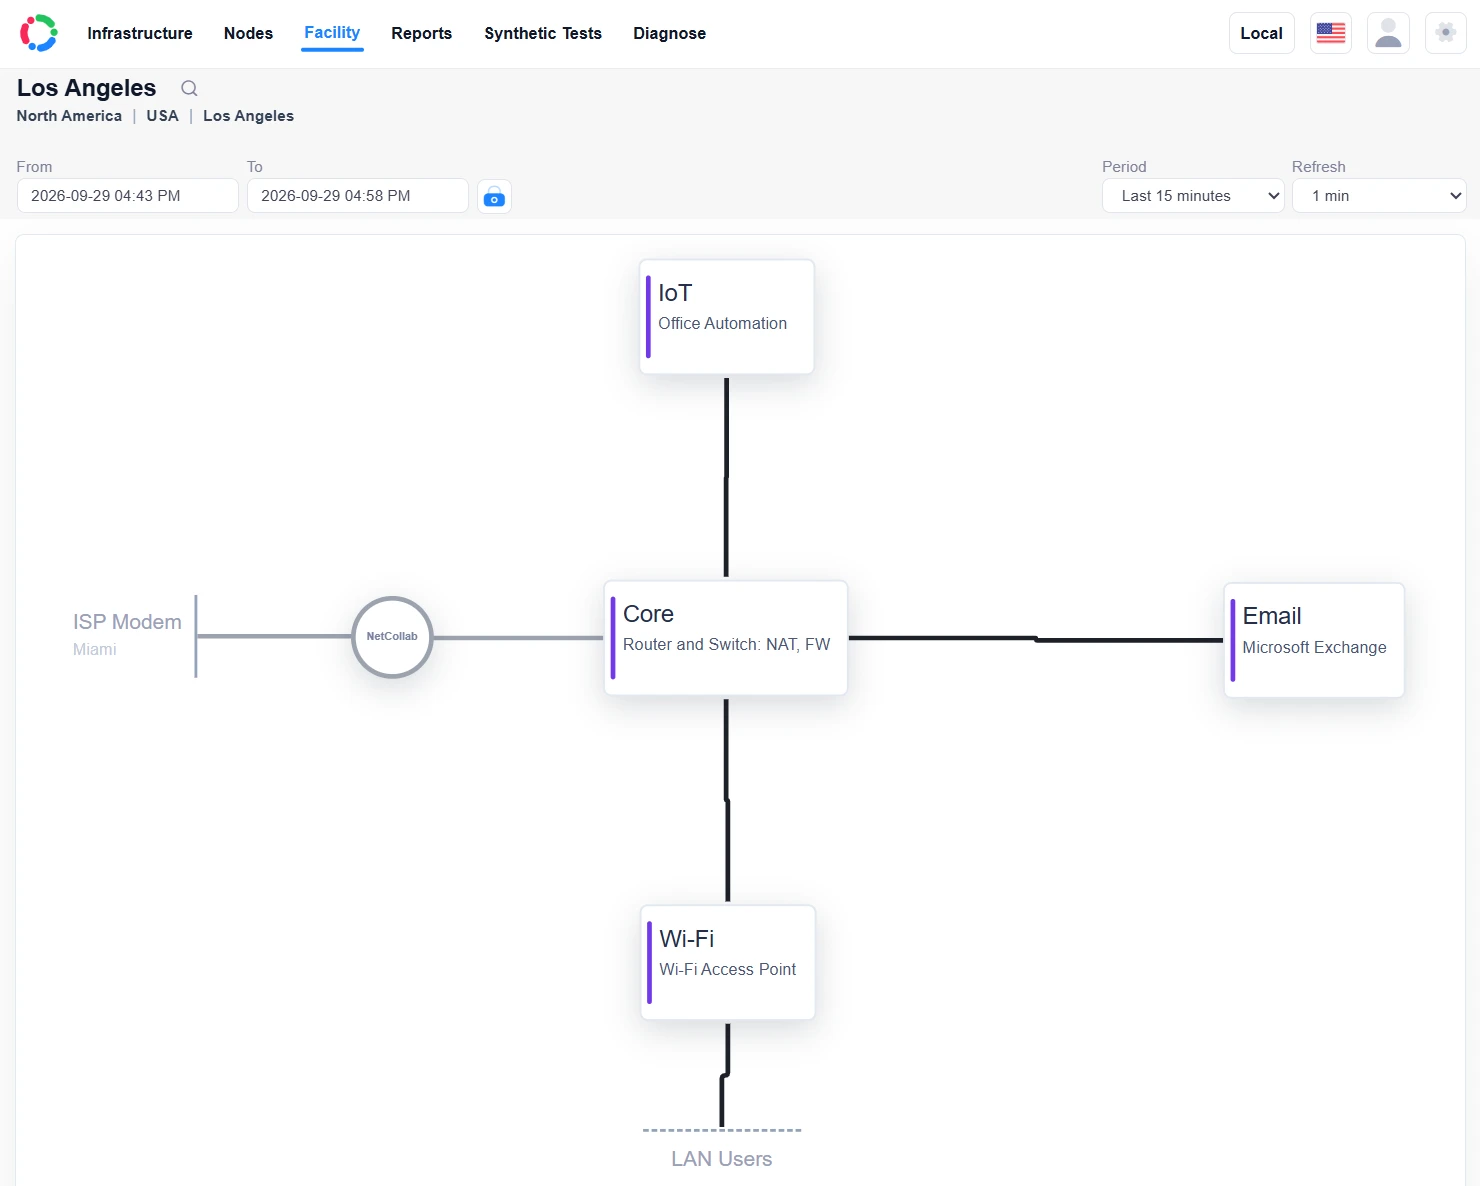
Move from an organization’s facilities to the network diagram of the site you need to investigate. Keep the deployment context close to the technical detail.
 View full screenshot
 Reports that answer the next question
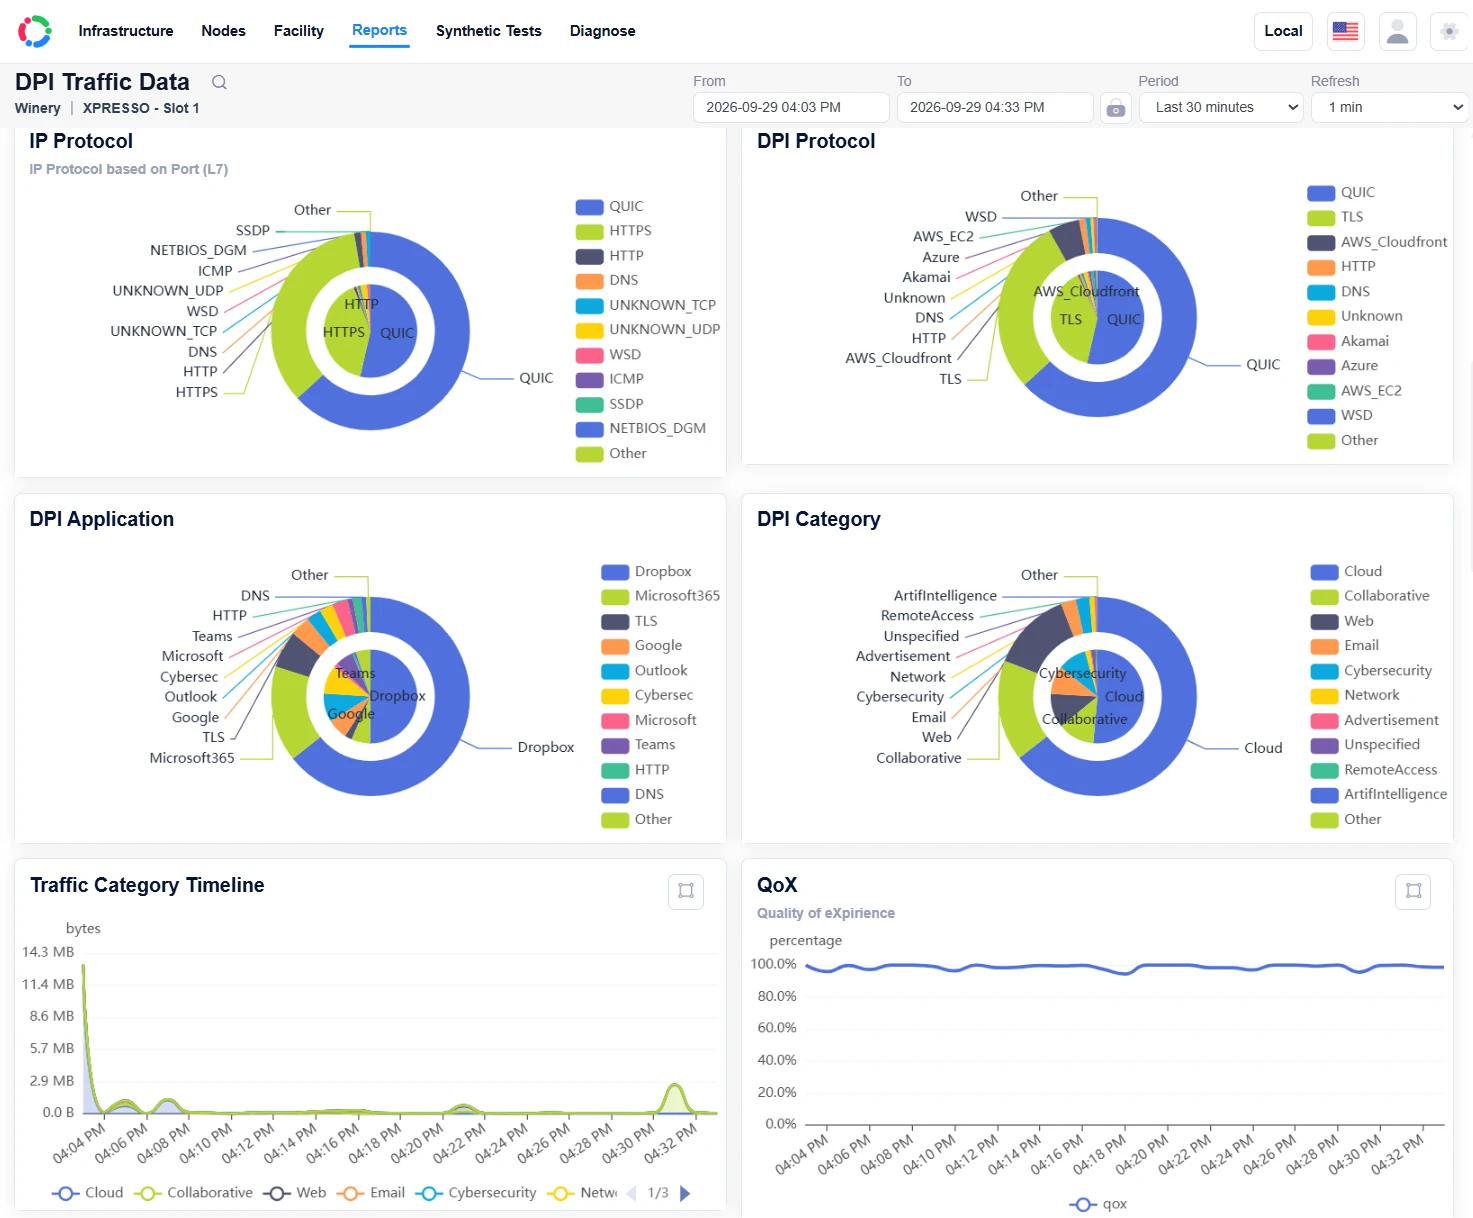
Explore DPI and traffic reporting, dynamic reports and synthetic test results. Central is where the statistics collected by your monitoring nodes become reports your team can use.
 View full screenshot
 Put a complaint in context
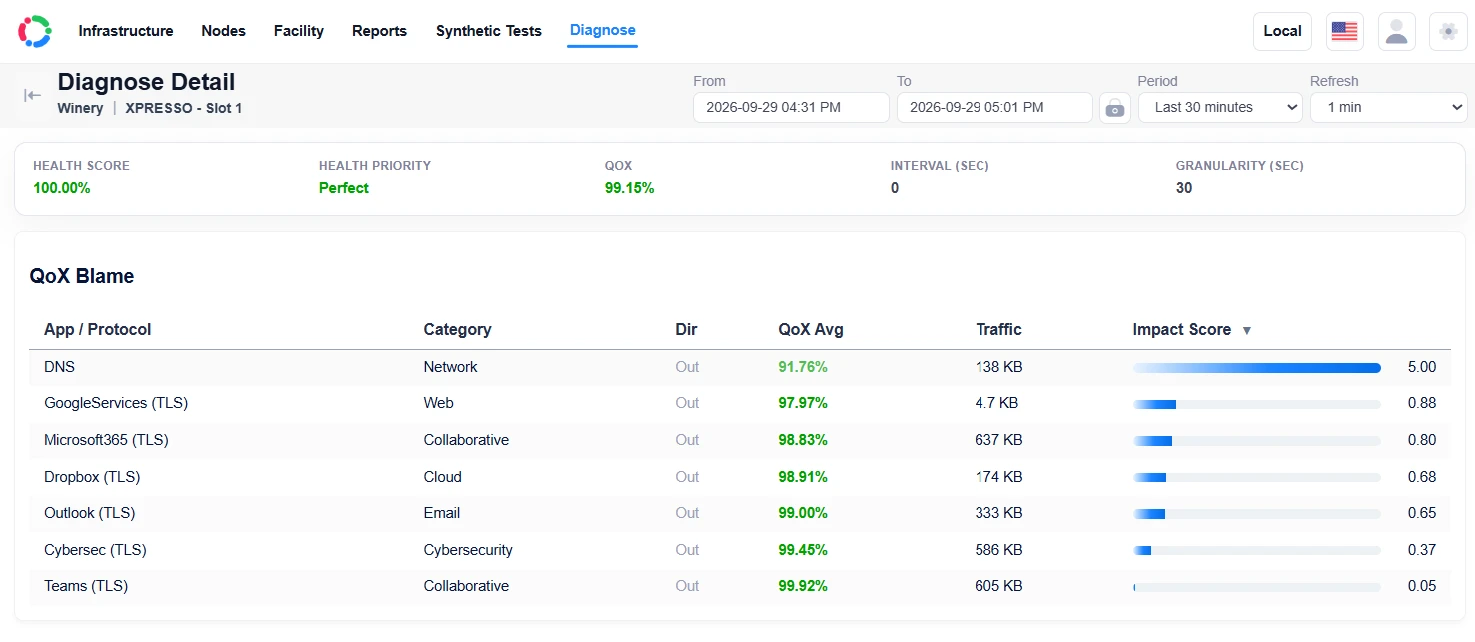
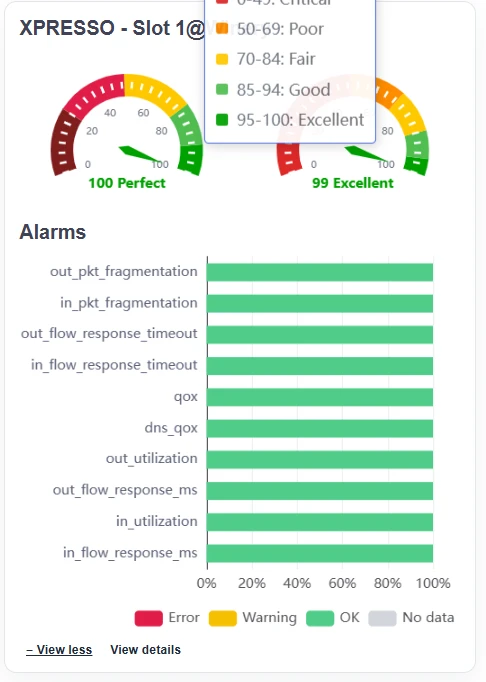
Use the Diagnose pages to explore alarms and Quality of Experience (QoX) alongside network evidence. Build a clearer picture of what happened before deciding where to investigate next.
 View full screenshot
  View full screenshot
 One platform. Two deployment options.
Central brings together the management frontend, APIs and reporting database. Choose the environment that fits how your organization operates and manages its data.
Use the hosted Central service with your NetCollab deployment. Cloud free tiers are available; discuss the included functions and limits for your needs.
Requires NetCollab hardware with a UAC or monitoring role enabled.
Request Central Cloud pricing →Purchase a local Central hardware solution to operate management, APIs and reporting within your network. Plan the hosting environment around your data-control and operational needs.
Central hosting hardware and deployment requirements are scoped separately from monitoring and UAC nodes.
Discuss local Central pricing →Paid cloud and local Central offers are quoted for your deployment. View the pricing page →
Build around your network
Discuss your facilities, reporting needs and preferred data environment.